Real-time Visualizations & Dashboards with Epoch and Python

There are a ton of dashboard and visualization tools out there – D3.js, EON and others, some of which you can find tutorials on right here at PubNub’s blog.
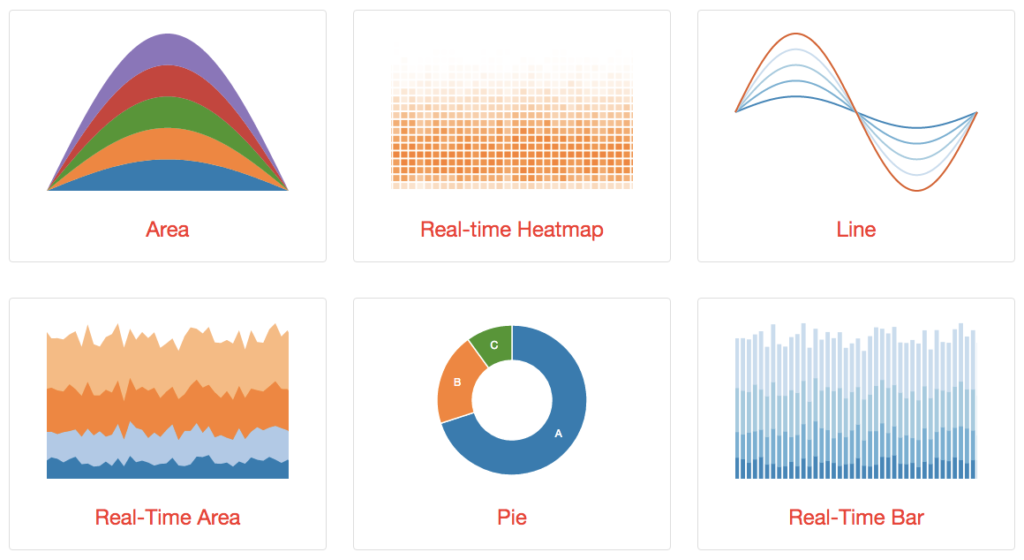
In this tutorial, we’ll look at another option, Epoch, a general purpose real-time charting library for building beautiful, smooth, and high-performance visualizations. Epoch has a couple of neat features right out of the box:
- It’s focused on real-time data
- It’s built on D3.js
- It has very simple APIs
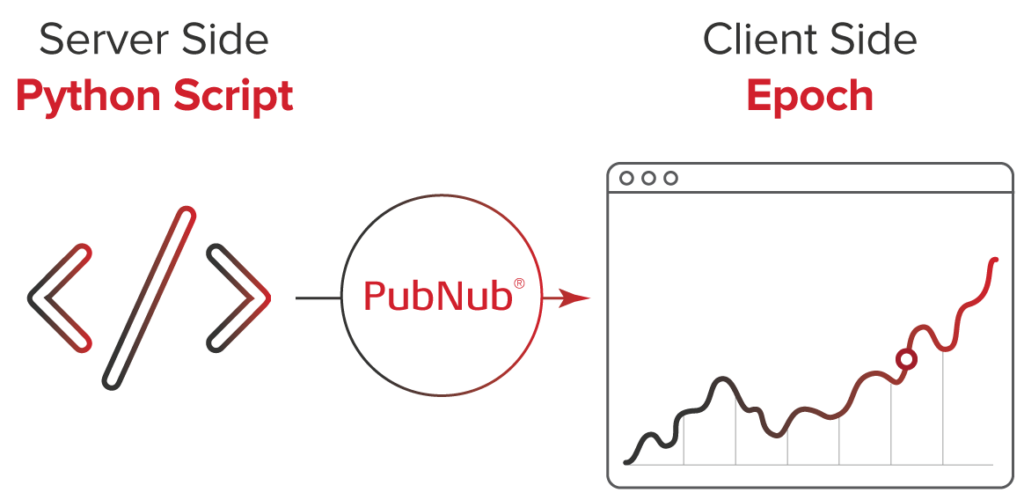
We will be building a real-time chart using Epoch with our data source being a Python script, showing the power of cross-language SDKs of PubNub.
Epoch
Epoch is a charting library for application developers and visualization designers. It focuses on two different aspects of visualization programming:
- Basic charts for creating historical reports
- Real-time charts for displaying frequently updating time series data

Diagram

Source to Code
All the source code you need for the tutorial is available here.
Server Side: The Data Source
As per the diagram above, let’s start with Python script which acts as a data source and from where the data is generated and published to the PubNub’s channel.
Firstly, let’s import some of the Python packages that we are going to use.
randintis responsible for generating random integer.Pubnubis to import PubNub’s Python SDK.threadingis present as we want to use one of it’s methods to execute a function at fixed interval of time.datetimeandtimeare to get time and convert time to desired format.
from random import randint
import threading
from pubnub import Pubnub
from datetime import datetime
import time
Initialize global variable for PubNub.
pn = 0
Start with the main() function from where the programs starts getting executed. Inside that, we define the pubnub constant ‘pn’ with publish and subscribe key. Then we mention the function loop(), which will run for the first time and then repeat itself.
def main():
   global pn
   pn = Pubnub(publish_key="demo", subscribe_key="demo", ssl_on=False)
   loop()
if __name__ == "__main__":
   main()
Here is how the loop() function looks.
def loop():
    threading.Timer(1, loop).start()
    num = randint(0, 10)
    print(num)
    dt = datetime.now()
    timestamp = int((time.mktime(dt.timetuple()) + dt.microsecond/1000000.0)*1000)
    object = dict(time=timestamp, y=num)
    pn.publish(channel="epoch-pubnub", message=object)
threading.Timer(1, loop).start() tells a thread to executes a function named ‘loop’ after
every 1 second has passed and then to start the timer.
Then we create a random integer between 0 and 10 and store it in num using num = randint(0, 10)
We get the current date and time using dt = datetime.now()
Now, if we go through the docs of EpochJS and look at the example of real-time line chart, it expects the data in a specific format.
{
    "time": timestamp,
    "y": some_value
}
timestamp = int((time.mktime(dt.timetuple()) + dt.microsecond/1000000.0)*1000) converts current time to timestamp.
Then we create a python dictionary of key value pairs which EpochJS expects.
object = dict(time=timestamp, y=num)
Lastly, we just publish the above object to PubNub’s channel using pn.publish(channel="epoch-pubnub", message=object).
Client Side: The Visualization
Let’s get started with the client side aspect of this demo. You can download Epoch from the home page of their site.
Once you extract the downloaded zip file, run following two commands:
npm install– it installs the npm packages required to develop epoch.gulp build– it fully rebuilds the source.
If you go epoch-0.8.4/tests/render/real-time/ folder, you will see a file line.html, which is an example of real time line chart. You can open it in browser and interact with line chart example.
Let’s just create a copy of this file in the same folder, name it as ‘line copy.html’ and work with it.
This is how the head section of the HTML file will look like:
       <link rel="stylesheet" type="text/css" href="../css/tests.css">
       <script src="https://cdn.pubnub.com/pubnub-3.7.13.min.js"></script>
       <script src="https://code.jquery.com/jquery-1.12.0.min.js"></script>
       <script>window.jQuery || document.write('<script src="js/vendor/jquery-1.12.0.min.js"><\/script>')</script>
       <script src="http://d3js.org/d3.v3.js" charset="utf-8"></script>
       <script src="../../../dist/js/epoch.js"></script>
       <link rel="stylesheet" type="text/css" href="../../../dist/css/epoch.css">
It already came with couple of CSS files and JS files for D3 and Epoch. We added the CDN for PubNub and jQuery.
Inside the body tag, we have div with a class ‘epoch’ is where we will embed the chart.
<h1>Real-time Line Plot Test</h1>
<div id="test-3" class="test">
      <div class="epoch" style="width: 600px; height: 200px"></div>
</div>
Now comes the main section of client side aspect:
leftRange specifies the values to be shown on the left Y-axis.
var leftRange = [0, 10];
label is the name of the layer, range is the one we defined above and values is where the object coming from PubNub’s channel gets pushed.
var data = [{ label: 'A', range: leftRange, values: [] }];
Initialize the PubNub with subscribe key.
var pubnub = PUBNUB({
    subscribe_key : 'demo'
});
Now we create a chart variable. There is a .epoch method that comes from EpochJS, which takes the following parameters: type (type of chart; we have verify this from Epoch docs), data (the data variable we created above), range and axes (here, we want to show only left and bottom axes). 'Time.line' means it’s a time series chart of line type.
var chart = $('#test-3 .epoch').epoch({
       type: 'time.line',
       data: data,
       range: {
         left: leftRange
       },
       axes: ['left', 'bottom']
});
Lastly, we subscribe to the PubNub’s channel and push the messages we get from there to chart we just created above.
pubnub.subscribe({
        channel : "epoch-pubnub", // Subscribing to PubNub's channel
        message : function(message){
                chart.push([message]);
        }
})
Conclusion
You can get to creating real-time charts with Epoch and PubNub quickly. You can find out more at the real-time section of EpochJS website on how to work with bar charts, gauge, heat map and area. You can use this for analytics, IoT, or monitoring with hardly any effort due to straightforward APIs.